Lotyšsko
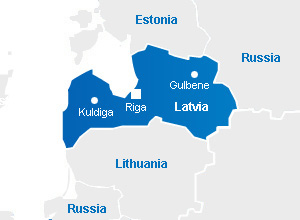
Situated in northeastern Europe along the Baltic Sea, Latvia shares borders with Estonia, Russia, Belarus, and Lithuania.
Strong bioeconomy sector
Total area: 64,594 sq km (slightly larger than West Virginia)
Population: 1.9 million
Government type: Parliamentary democracy
Administrative division: 110 municipalities (called „novads“) and 9 republic cities
Capital + other major cities: Riga (614,000) + Daugavpils (79,000), Liepaja (67,000), Jelgava (55,000)
Currency: euro (since January 2014)
Languages: Latvian (official) 56.3%, Russian 33.8%, other 0.6% (includes Polish, Ukrainian, and Belarusian), unspecified 9.4%
Ethnicity:Latvian 62.7%, Russian 25.5%, Belarusian 3.1%, Ukrainian 2.2%, Polish 2%, Lithuanian 1.1%, other 1.8%, unspecified 2.6%
Religion: Lutheran 36.2%, Roman Catholic 19.5%, Russian Orthodox 19.1%
President: (Mr.) Edgars RINKĒVIČS (since 8 July 2023)
Prime Minister: (Ms.) Evika SILIŅA (since 15 September 2023)
Date of EU accession: 1 May 2004
KEY FEATURES
- Forests cover more than half of its territory
- Predominantly low-lying terrain (less than 100 m/330 ft above sea level)
- One of the highest shares of renewable energy production in CEE
- 0% tax on reinvested company profit
- Linguistic connections with Lithuania to the south and historical and religious ties with Estonia to the north
- A significant Russian-speaking population, accounting for around one-third of residents
- A small, open economy, with exports accounting for a substantial share of GDP
- Long-term challenges include demographic decline and a low birth rate
MACROECONOMIC OVERVIEW
Since gaining independence in 1991, Latvia has successfully implemented deep, market-oriented reforms, evolving into a resilient high-income economy integrated into the EU (since 2004) and the euro area (since 2014). While the economy expanded steadily in the years following the 2008 financial crisis, it has more recently navigated a challenging period marked by high inflation and a strategic decoupling from trade with Russia. Today, economic growth is driven primarily by domestic consumption and a dynamic export sector.
From a macroeconomic perspective, Latvia’s economy experienced a mild contraction in 2023 and 2024 and is expected to recover in 2025, with growth gradually strengthening to around 1.7% in 2026 and 1.9% in 2027. The unemployment rate has declined significantly from its 2010 peak of 19.5% and is expected to remain stable at around 6.5%. Inflation is projected to remain in the 3-4% range in the coming years, driven by rising wages and elevated food prices.
The country faces significant structural and demographic challenges, caused by a low birth rate combined with the continued emigration of young, skilled workers. These trends have led to substantial population declines in both rural areas and major urban centers, constraining long-term labor supply and potential growth.
Selected economic indicators, Latvia, 2018 - 2024
| 2018 | 2019 | 2020 | 2021 | 2022 | 2023 | 2024 | ||
| GDP |
|
|
|
|
|
|
|
|
| Real GDP growth |
%
|
4.0 | 0.6 | -3.5 | 6.7 | 1.9 | -0.9 | 0.0 |
| GDP at current prices |
€ bn
|
29.06 | 30.48 | 30.26 | 33.61 | 38.3 | 39.3 | 40.2 |
| Foreign trade |
|
|||||||
| Exports |
€ bn
|
17.92 | 18.33 | 17.8 | 21.05 | 27.84 | 25.84 | 25.9 |
| Imports |
€ bn
|
18.12 | 18.55 | 17.45 | 21.74 | 29.76 | 27.4 | 27.0 |
| Balance |
€ bn
|
-0.2 | -0.21 | 0.34 | -0.68 | -2.27 | -1.55 | -1.1 |
| Prices |
|
|||||||
| CPI – average inflation rate |
%
|
2.6 | 2.7 | 0.1 | 3.2 | 17.2 | 9.1 | 1.3 |
| PPI – industry – average |
%
|
5.5 | 3.6 | -3.2 | 12.5 | 49.5 | 1.7 | -7.6 |
| Employment |
|
|||||||
| Registered unemployment |
%
|
7.4 | 6.3 | 8.1 | 7.6 | 6.9 | 6.5 | 6.9 |
| Average monthly gross wage |
€
|
1,004 | 1,076 | 1,143 | 1,227 | 1,373 | 1,537 | 1,685 |
Source: Central Statistics Bureau of Latvia, IMF, OECD, World Bank, Eurostat, 2018-2025
KEY SECTORS
The agricultural sector accounts for approximately 3.6% of GDP and employs about 6.8% of the active population. It is dominated by cattle breeding and dairy farming, alongside the production of cereal crops (barley, wheat, rye, and oats), as well as sugar beets, potatoes, and vegetables. Apart from timber, which is largely exported, Latvia has very limited natural resources. Roughly 35% of the country’s territory is used for agricultural purposes. Fishing is also an important component of the primary sector. Latvia has a long fishing tradition dating back to the Soviet period, with species such as salmon and trout traditionally among the main catches. In recent years, the government has introduced measures to protect valuable fish stocks, alongside the development of aquaculture and fish farming.
The industrial sector roughly contributes to 20% of the GDP and employs almost one-fourth of the active workforce (23%). The leading manufacturing sectors are woodworking, followed by mechanical engineering and metalworking, and food production. Latvia is also a recognized regional leader in 5G infrastructure, fiber optics, and drone technology. The construction sector has also seen significant growth, driven largely by the massive Rail Baltica infrastructure project. Often referred to as the „project of the century“, the new high-speed rail line will connect Helsinki (Finland) with Berlin (Germany) via Estonia, Latvia, and Lithuania, fully integrating these countries into the EU rail system.
The Latvian economy is primarily driven by the service sector, which accounts for approximately 64% of GDP and employs around 70% of the active population. Among the most important service industries, transportation and information and communications technology (ICT) play a key role.
Forestry & Woodworking
With forests covering over 50% of national territory, Latvia has one of the richest forest resources in Europe. The forestry and wood-processing sector plays a central role in the country’s economy and industrial structure, accounting for around 31% of total manufacturing turnover. The sector is highly export-oriented and employs approximately 17,000 people. Latvia’s wood industry is well diversified and increasingly focused on higher value-added products, including engineered wood solutions such as cross-laminated timber (CLT).
Food Processing & Beverages
The food processing and beverage industry is one of Latvia’s most established manufacturing sectors, accounting for approximately 18% of total manufacturing output and employing around 22,000 people. Key sub-sectors include dairy products, grain milling, fish processing, and beverages.
The industry’s competitiveness is increasingly driven by a focus on quality and sustainability, with around 15.3% of agricultural land dedicated to organic farming. Significant investments are also made in production automation and "green" packaging.
Metal Processing and Mechanical Engineering
The metalworking and mechanical engineering sector is one of Latvia’s most technologically advanced industries, contributing approximately 20% of total manufacturing turnover and nearly 24% of goods exports. Historically, Latvia served as a technologically advanced manufacturing center for the Soviet military and aerospace industries. Today, the sector is focused on highly specialized, high value-added products, including electronics, precision mechanics, and optical instruments, alongside the production of medical equipment. Latvia is among the global leaders in the manufacturing of optical fiber products.
Transport and logistics
Transport and logistics are a cornerstone of Latvia’s service economy, accounting for approximately 6.1% of GDP. The sector benefits from Latvia’s strategic geographic location, well-developed infrastructure, and a diversified transport network combining rail, maritime, and road transport. This network integrates three major ice-free ports (Riga, Ventspils, and Liepāja) with an extensive rail and road system.
Historically, Latvia has played an important role as a transit corridor between Western Europe and Russia. However, the war in Ukraine and disruptions to traditional trade routes have led to a significant decline in freight volumes across all modes of transport. In response, the sector is undergoing structural adjustment, actively redirecting services toward new markets and strategically reducing its dependence on Russia.
ICT
The ICT sector has solidified its position as the nation’s most dynamic economic pillar, consistently achieving annual growth rates of 20–30% and contributing approximately 6.7% to national GDP. This growth is underpinned by a highly qualified, multilingual workforce and a digital infrastructure that ranks among the best in the OECD, characterized by exceptional mobile data usage and a robust 5G ecosystem. The Global Business Services (GBS) and shared services sector has matured into a high-value hub centered in Riga, now employing nearly 20,000 professionals who have shifted their focus from basic development to complex domains such as cybersecurity, artificial intelligence, and military and civilian 5G applications.
Chemical and pharmaceutical industry
The sector accounts for 10% of the manufacturing industry and ranks fourth by turnover among manufacturing industries. It has strong R&D capabilities, particularly in pharmaceuticals, recycling, green chemicals, and biocosmetics, which contribute to high export levels.
EXPORTS & IMPORTS
Latvian exports are a cornerstone of the national economy, with goods and services accounting for approximately 65% of GDP. Trade is heavily oriented toward the European Union, with nearly 80% of exports going to EU markets, primarily Lithuania, Estonia, and Germany. While wood and electrical machinery remain the leading physical exports, the IT and Global Business Services sectors have become important drivers of growth.
2024 export and import data:
Main import partners:
Lithuania – 20.7%
Germany – 11.7%
Poland – 11.3%
Estonia – 8.6%
Finland – 5.6%
Main export partners:
Lithuania – 18%
Estonia – 11.7%
Germany – 6.5%
Sweden – 5.5%
Russian Federation – 5.5%
Market Research in Latvia
EasyLink provides professional expertise in strategic market research, market intelligence, competitive intelligence, market size analysis and market potential evaluation, competitive landscape and distribution structure study, identification of new customers and potential partners etc. Please contact us to discuss how we can assist your business objectives in export, marketing or sourcing.
Customer Search & Partner Search in Latvia
We are experienced experts in matchmaking projects involving the search, identification, screening and pre-selection of business partners in Central & Eastern Europe, ranging from distributor search to profiling of prospective customers and identifying specific business opportunities; we assist our clients with sourcing in emerging markets and low-cost markets in the CEE region.
International Trade Consultancy – Export, Marketing and Trade Promotion in Latvia and the Baltic region
EasyLink has a unique track record in international trade promotion. With local consultants in all key markets in Central & Eastern Europe, EU markets and some overseas markets, we provide customized market research, develop trade opportunities with prospective partners and new customers, and assist clients with strategic advice for their export, marketing and sourcing needs.